How to Build a SaaS Financial Forecast Model: Step-by-Step Guide + Example
I’ve built over 1,000 SaaS financial forecasts as an in-house CFO, as a fractional CFO, and now as someone who teaches this framework to finance teams around the world. And I can tell you with confidence: most SaaS companies are doing this wrong.
Not because they’re bad at finance. Because nobody ever showed them the right structure.
A SaaS financial forecast is not just a spreadsheet. It’s not a revenue guess with some expense lines below it. It’s a connected model built from four specific data sources, with revenue, headcount, department expenses, cash flow, and SaaS metrics forecasted in a deliberate sequence before you ever build your final P&L output.
This guide walks you through the five-step SaaS forecast model framework I use for every forecast I build. I’ll use a $7M ARR SaaS company as the running example so you can see how the math works.
Want the working Excel version? This article explains the framework. Inside the SaaS Forecast Model Course & Excel Template, I walk through the actual model build tab by tab, including the ARR waterfall, revenue forecast, headcount plan, department expense schedules, SaaS P&L, cash forecast, and metrics dashboard.
Table of Contents
- What Is a SaaS Financial Forecast?
- Why Most SaaS Forecasts Break Down
- SaaS Forecast vs. SaaS Budget vs. SaaS Financial Model
- Step 1: Gather Your 4 Key Data Sources
- Step 2: Forecast Revenue by Stream
- Step 3: Forecast Headcount — Your Biggest Line Item
- Step 4: Forecast Department Expenses
- Step 5: Build Your SaaS P&L Output and Key Metrics
- Common Mistakes in SaaS Financial Forecasting
- SaaS Forecast Model Course & Excel Template
- FAQ: SaaS Financial Forecasting
What Is a SaaS Financial Forecast?
A SaaS financial forecast is a forward-looking operating model that projects revenue, expenses, headcount, cash flow, and key SaaS metrics over a defined period.
Unlike a basic company budget, a SaaS forecast connects ARR, bookings, churn, expansion, hiring, department spending, gross margin, cash runway, and SaaS metrics into one model. The goal is not just to produce a P&L. The goal is to help the leadership team make better decisions about growth, hiring, capital, efficiency, and cash.
A good SaaS forecast model should answer questions like:
- How much ARR will we end the year with?
- How much revenue will we recognize each month?
- How many people can we afford to hire?
- Which departments are driving the most spend?
- What happens to cash if sales bookings are delayed?
- How does churn impact growth and runway?
- What does the board-ready version of the plan look like?
The best SaaS forecasts are not built from top-down growth percentages. They are built by the operating drivers of the business.
Why Most SaaS Forecasts Break Down
Before we get into the steps, here’s the honest reality: many SaaS companies miss their forecast because they do not have the right structure. And the right data.
The issue usually is not forecasting skill. It is forecasting architecture. Teams jump straight to revenue projections without the right data inputs. They forecast at the company level instead of by department. They guess at headcount instead of mapping roles to business drivers. They build a P&L before they build the supporting schedules that should feed the P&L.
The five-step framework below fixes that.
At a high level, the model architecture looks like this:
Inputs → Revenue Schedules → Headcount Plan → Department Expense Schedules → SaaS P&L → Cash Forecast → SaaS Metrics Dashboard
That sequence matters. If you build the P&L first, you are usually hardcoding outcomes. If you build the supporting schedules first, the P&L becomes the output of your operating assumptions.
SaaS Forecast vs. SaaS Budget vs. SaaS Financial Model
These terms are often used interchangeably, but they are not exactly the same.
|
Term |
What It Means |
How It Is Used |
|
SaaS budget |
The annual operating plan approved by leadership or the board |
Sets targets, spending limits, and accountability for the year |
|
SaaS forecast |
The current best estimate of where the business is heading |
Updated monthly or quarterly as actuals, pipeline, hiring, and cash change |
|
SaaS financial model |
The broader Excel or planning model that may include forecasts, scenarios, fundraising plans, valuation, or strategic cases |
Used for planning, board reporting, fundraising, scenario analysis, and decision support |
Your budget is the baseline. Your forecast is the live view. Your SaaS financial model is the engine that connects the assumptions and outputs.
Step 1: Gather Your 4 Key Data Sources
Before you build a single formula, you need four clean data pulls. I call these the “four key SaaS data sources” of any SaaS financial forecast. Skip one, and the whole model is on shaky ground.
|
Data Source |
System |
What to Pull |
Why It Matters |
|
Financial data |
GL/accounting system |
12–24 months of P&L, department-level actuals |
Establishes your real cost structure and historical trends |
|
Bookings data |
CRM |
New logo ARR, expansion ARR, contraction, pipeline, close dates, and stage probabilities |
Feeds your ARR forecast and revenue forecast |
|
Customer and revenue data |
Billing or subscription system |
Customer-level ARR/MRR, contract start and end dates, renewal dates, pricing, usage, and billing cadence |
Supports renewal forecasting, revenue recognition, and churn/expansion assumptions |
|
HRIS data |
HR/payroll system |
Current roster, department, role, start date, compensation, benefits, open roles, and planned hires |
Drives the headcount plan and wage expense forecast |
1. Financial Data: Your GL/Accounting System
Pull 24 months of actuals from your general ledger. The P&L by department if possible. You want to understand your actual cost structure before you project forward.
For our $7M ARR example, this might show that sales and marketing ran at 38% of revenue last year and engineering ran at 27%.
2. Bookings Data: Your CRM
Bookings data is new ARR signed in a period, broken down by new logo, expansion, contraction, and churn. This is how you forecast where subscription revenue is going.
If you are only looking at revenue without looking at the bookings pipeline that feeds it, you are flying blind. Your CRM — Salesforce, HubSpot, or another sales system — should be the source of truth here.
3. Customer and Revenue Data: Your Billing System
You need a customer-level revenue file: who is paying, what they are paying, their contract start and end dates, whether they have usage-based components, and their renewal schedule.
For a $7M ARR company, you might have 150–300 customers. You need to know which ones renew in Q1, which are at risk, and which have expansion potential baked into the contract.
4. HRIS Data: Your HR/Payroll System
Pull your current headcount roster: name, department, role, start date, fully loaded cost, and open requisitions. In many SaaS companies, headcount is the largest operating expense category. You cannot build an accurate SaaS operating model without knowing exactly what you are paying people and when new hires are expected to start.
Bottom line: These four data sources should be refreshed every time you build or update a forecast. If you are building your annual budget in November, you want actuals through October and a clean snapshot of each of these four inputs.
Course preview: In the SaaS Forecast Model Course, this is where the model build starts. We do not begin with the P&L. We begin with the input tabs that drive the forecast.
Step 2: Forecast Revenue by Stream
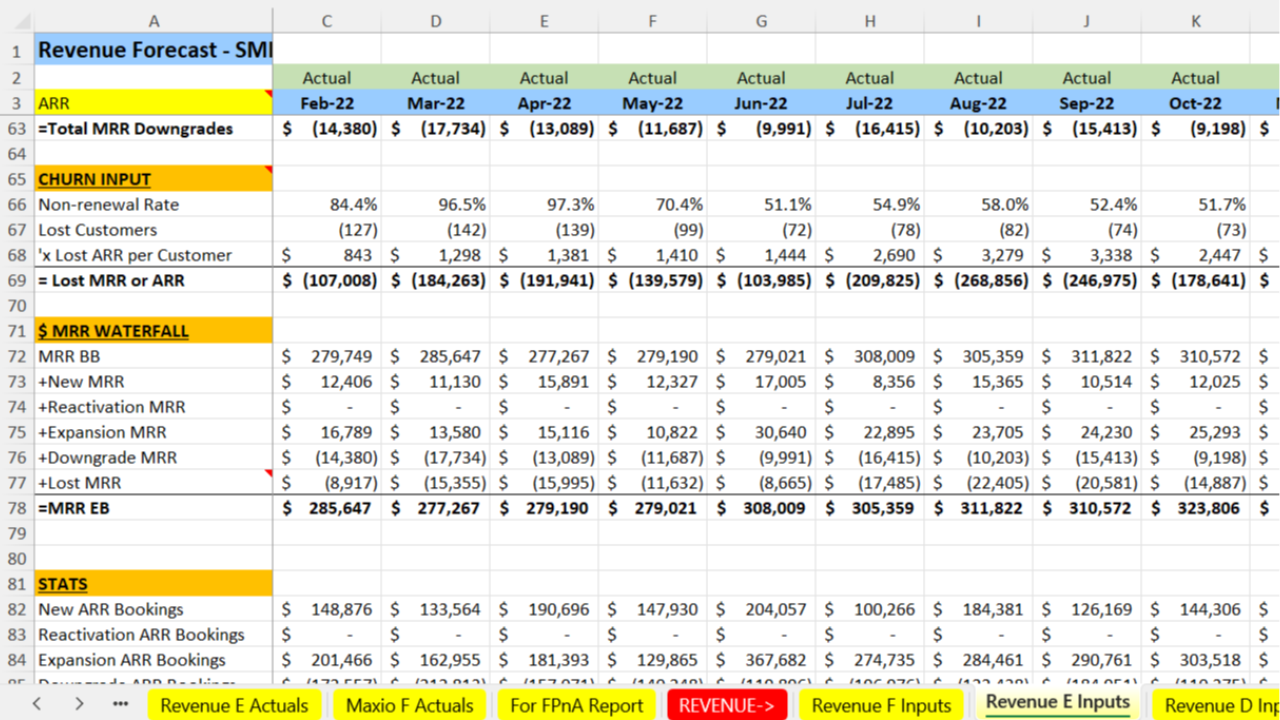
SaaS revenue is not monolithic. I break it into three distinct streams, each with its own forecast methodology. For recurring revenue, I also separate the ARR movement layer into new ARR, expansion ARR, contraction ARR, and churned ARR so the model does not hide downgrades inside churn.
Subscription Revenue: Your ARR/MRR Forecast
Subscription revenue is your core recurring revenue, and you forecast it with a bookings model, not a simple growth rate.
The mechanics look like this:
Beginning ARR + New ARR + Expansion ARR - Contraction ARR - Churned ARR = Ending ARR
For our $7M ARR company:
|
ARR Movement |
Amount |
|
Beginning ARR |
$7,000,000 |
|
New ARR |
$1,400,000 |
|
Expansion ARR |
$350,000 |
|
Contraction ARR |
($140,000) |
|
Churned ARR |
($280,000) |
|
Ending ARR |
$8,330,000 |
The $140K of contraction plus $280K of churned ARR equals $420K of gross ARR loss, or 6% of beginning ARR. Put another way, the company retains 94% of beginning ARR before expansion. That is the gross revenue retention view, and it is the number you want to compare against SaaS retention benchmarks. Separating contraction from churn matters because a downgrade is a different operating problem than a full customer loss.
The $8.33M in ending ARR is your forward-looking subscription revenue base. From there, convert ARR to monthly recognized revenue using your billing cadence, contract terms, and revenue recognition rules. That gives you your subscription revenue forecast.
Variable or Usage-Based Revenue
If any portion of your revenue is usage-based — API calls, transactions, seats above a minimum, consumption, storage, or overages — forecast it separately using customer-level usage trends.
Do not lump it into subscription revenue. The volatility profile is completely different.
For our $7M ARR company, let’s say $700K of revenue is usage-based. Forecast this by cohort or customer segment or a rate x volume basis. I prefer rate x volume and potentially other drivers. What are similar customers doing on a usage-per-month trajectory? Are larger customers expanding usage faster? Are smaller customers more volatile? Are there seasonality patterns?
Professional Services Revenue
Professional services revenue includes implementations, onboarding fees, custom work, migrations, and other services. Forecast this from signed SOWs, your services backlog, expected go-lives, and the pipeline of new deals likely to include services.
If you have three signed implementation projects starting in Q1 at $40K each, you have $120K of Q1 services revenue visibility. Then you can add a probability-weighted pipeline factor for deals likely to close with services attached.
Pro tip: Keep these three revenue streams separate all the way through your SaaS forecast model. They have different gross margin profiles. Subscription revenue often has much higher gross margin than professional services revenue. Blending them hides what is actually happening in your business.
Step 3: Forecast Headcount — Your Biggest Line Item
Here is what most SaaS companies get wrong: they build a headcount plan as an afterthought. They decide on a revenue target, then work backward to figure out what people they need.
Flip it.
Headcount drives everything else — revenue capacity, product velocity, customer success coverage, G&A infrastructure, and cash burn. Build the headcount plan before you finalize the department expense forecast and P&L.
How to Structure Your SaaS Headcount Forecast
Map each role to a department: Sales, Marketing, Engineering/Product, Customer Success, Services, Support, and G&A. Then for each department, answer three questions:
- What headcount do we have today, and what is the fully loaded cost?
- What roles do we need to add, and when do they start?
- What is the ramp profile for revenue-generating roles?
For our $7M ARR company with 45 employees, let’s say the plan calls for hiring 12 new people over the next 12 months. At an average fully loaded cost of $130,000 per head — salary, benefits, payroll taxes, and other people costs that is $1.56M in incremental annualized headcount expense.
But the actual spend depends entirely on when those people start.
A sales AE who starts in January at $130K/year costs $130K in the forecast year. The same hire starting in October costs $32,500 in the forecast year. Timing is everything.
Headcount Forecast Output
Your headcount forecast should produce a monthly roll-up by department showing:
- Headcount at start of month
- New hires
- Attrition
- Headcount at end of month
- Monthly wage expense by department
- Fully loaded cost by department
This feeds directly into your departmental expense model in Step 4.
The most common mistake is hiring plan optimism. Teams assume every hire starts on time, ramps on time, and stays all year. Your forecast should include delayed starts, sales ramp, attrition, and open role timing.
Course preview: In the SaaS Forecast Model Course, the headcount tab is one of the most important parts of the model. You will learn how to structure the forecast by department, role, start date, fully loaded cost, and monthly expense impact.
Step 4: Forecast Department Expenses: Non-Wage OpEx
Once headcount is locked, forecast the non-wage operating expenses by department. I build this as a separate schedule for each functional area.
|
Department |
Common Non-Wage Expense Lines |
|
Sales |
CRM, sales engagement tools, commissions, variable compensation, travel, events, sales enablement |
|
Marketing |
Paid acquisition, content, agencies, events, marketing tech stack, sponsorships |
|
Engineering/Product |
Development cloud infrastructure, development tools, contractors, product analytics, testing tools |
|
Customer Success |
CS platform, customer health/scoring tools, QBR and customer training programs, onboarding tools, customer travel |
|
Support |
Help desk platform, knowledge base tools, chat/support software, support QA tools, customer support training, outsourced support if used |
|
Professional Services / Implementation |
Implementation tools, services contractors, migration tools, training materials, subcontractors, travel, project delivery costs |
|
G&A |
Audit, legal, D&O insurance, finance software, HR systems, office/facilities |
Do not forecast every expense line the same way. Different expenses need different drivers.
|
Expense Type |
Forecasting Method |
|
Fixed recurring vendors |
Forecast from contract amount and renewal date |
|
Headcount-driven tools |
Forecast based on number of employees or users |
|
Commissions |
Forecast from bookings and compensation plan logic |
|
Cloud hosting |
Forecast based on usage, customers, revenue, or product volume |
|
Paid marketing |
Forecast from budget, CAC, pipeline goals, or campaign plan |
|
Events and travel |
Forecast by planned events, department owner input, and timing |
|
Legal, audit, and insurance |
Forecast from vendor quotes, renewal dates, or prior-year run rate |
|
Support costs |
Forecast from ticket volume, customer count, support coverage model, outsourced support contracts, or support headcount |
|
Professional services delivery |
Forecast from signed SOWs, backlog, implementation hours, utilization, contractor costs, and services pipeline |
For our $7M ARR company, here is a rough expense profile. These are examples, not targets. Your actuals will vary based on growth rate, business model, stage, pricing, gross margin, and go-to-market motion.
|
Department |
% of Revenue |
$ Amount on $8M Run-Rate |
|
COGS |
~26% |
~$2,080,000 |
|
Sales & Marketing |
~38% |
~$3,040,000 |
|
R&D / Engineering |
~25% |
~$2,000,000 |
|
G&A |
~18% |
~$1,440,000 |
If your sales and marketing spend is running at 55% of revenue while growth is flat, that is a red flag worth examining. If engineering spend is high because you are rebuilding the platform, that may be intentional. The forecast should make those tradeoffs visible.
The key discipline: Forecast non-wage expenses by department, not as a single company-wide line. Support and Services deserve their own visibility because they directly affect gross margin, implementation capacity, customer experience, and cash. When you need to cut costs, invest more, or reallocate budget, you need to know where the money actually is.
Step 5: Build Your SaaS P&L Output and Key Metrics
Once you have revenue, headcount, and department expenses forecasted, assembling the P&L is straightforward. This is where the model comes together.
The SaaS P&L Structure
Revenue
- Subscription Revenue
- Variable / Usage Revenue
- Professional Services Revenue
= Total Revenue
Cost of Goods Sold (COGS)
- Dev Ops
- Customer Support
- Customer Success
- Professional Services
= Gross Profit / Gross Margin %
Operating Expenses
- Sales & Marketing
- Research & Development
- General & Administrative
= Total OpEx
= Operating Income / Loss or EBITDA
The P&L should not be a standalone worksheet filled with hardcoded assumptions. It should be the output of your underlying schedules.
The SaaS Metrics Dashboard
The P&L alone does not tell the whole story. Layer in these metrics as outputs of your forecast model:
|
Metric |
Why It Matters |
|
ARR / MRR |
Shows the recurring revenue base at the end of each period |
|
ARR growth rate |
Measures year-over-year or period-over-period growth |
|
Gross Revenue Retention (GRR) |
Shows how much existing ARR you keep before expansion |
|
Net Revenue Retention (NRR) |
Shows existing customer retention after expansion and contraction and churn |
|
Gross Margin % |
Shows profitability by revenue stream and blended margin |
|
CAC Payback Period |
Measures how long it takes to recover acquisition cost |
|
Rule of 40 |
Combines growth and profitability into one efficiency measure |
|
ARR per FTE |
Measures revenue efficiency per employee |
|
Cash runway |
Shows how long the company can operate before needing more capital |
For our $7M ARR example growing to $8.33M, ARR growth is approximately 19%. If the company has a blended gross margin of 72% and an operating loss of $1.4M on an $8M revenue run-rate, operating margin is roughly negative 17%.
That gives you a Rule of 40 score of approximately:
19% growth + (-17% operating margin) = 2%
That is below the Rule of 40 threshold, a signal to either accelerate revenue growth, improve gross margin, or tighten the cost structure.
Common Mistakes in SaaS Financial Forecasting
I see these across almost every company I work with.
1. Forecasting Revenue Without a Bookings Model
If you are projecting revenue by applying a growth percentage to last year’s number, you are guessing. Build the ARR waterfall and separate new ARR, expansion ARR, contraction ARR, and churned ARR. Contraction and churn should not be collapsed into one line because they point to different operating issues.
2. Forecasting Headcount as a Lump Sum
“We will add 10 people” is not a headcount plan. Map every hire by department, role, start month, compensation, and fully loaded cost.
3. Not Separating Revenue Streams
Blending subscription, usage-based, and professional services revenue hides your true SaaS gross margin and makes the model less accurate.
4. Skipping the Data-Gathering Step
Jumping straight into the model without clean actuals, a CRM pipeline export, customer revenue detail, and a current headcount roster leads to rework. Always start with the four data sources.
5. Forecasting at the Company Level Instead of by Department
Company-level forecasts are not enough for operational decisions. Every department head should own their portion of the forecast. You must forecast at the department-level for accuracy and accountability.
6. Treating the Forecast as a One-Time Event
A SaaS financial forecast should be refreshed monthly or, at a minimum, quarterly. Actuals vs. forecast variance analysis is how you improve accuracy over time.
7. Forgetting the Cash Forecast
The P&L does not equal cash. Annual upfront billing, deferred revenue, collections timing, vendor prepayments, and payroll timing can all create major differences between revenue, EBITDA, and cash.
Putting It All Together
A complete SaaS financial forecast model should produce:
- A 12-month or 3-year P&L with revenue by stream, COGS, and department-level OpEx
- A headcount plan with monthly adds, attrition, and fully loaded cost by department
- An ARR waterfall showing new ARR, expansion ARR, contraction, and churn month by month
- A SaaS revenue forecast that converts ARR and bookings into recognized revenue
- A department expense forecast for wage and non-wage OpEx
- A cash forecast derived from your P&L, billing, collections, payroll, and working capital assumptions
- A SaaS metrics dashboard with GRR, NRR, gross margin, CAC payback, Rule of 40, ARR/FTE, and runway
This is the framework. Building the actual model — wiring up the data sources, creating the ARR waterfall logic, structuring the headcount tab, building the P&L assembly, and connecting the cash forecast — is where the real work happens.
Build the SaaS Forecast Model in Excel
This guide gives you the framework. But the real work is building the model: the ARR waterfall, revenue schedules, headcount plan, department-level OpEx, SaaS P&L, cash forecast, and metrics dashboard.
In the SaaS Forecast Model Course & Excel Template, I walk you through the full model build step by step using the same structure I use with SaaS companies.
You will get:
- A working SaaS Excel forecast model template (can be uploaded to Google Sheets)
- A tab-by-tab video lesson walkthrough
- ARR, revenue, headcount, OpEx, P&L, and basic cash forecast
- SaaS metrics tabs that calculate the important metrics
- A board-ready structure you can adapt to your own company
This course is built for FP&A, CFOs, finance leaders, investors, and operators who need to build or improve a SaaS or AI forecast model for budgeting, board reporting, fundraising, or cash planning.
If you are staring at a blank spreadsheet before budget season, this course gives you the structure I use with real SaaS companies.
Start the SaaS Forecast Model Course here: SaaS Forecast Course and Template
FAQ: SaaS Financial Forecasting
How far out should I forecast?
Most SaaS companies maintain a rolling 12-month forecast and a 3-year strategic model. The 12-month model is your operational tool and should be refreshed monthly. The 3-year model is usually used for board decks, fundraising, and strategic planning.
How do I forecast a SaaS company that is growing fast with limited history?
Lean heavily on pipeline, bookings data, sales capacity, and customer-level ARR data rather than trailing revenue trends. If you are growing 100%+ year-over-year, your historical run rate may be a poor predictor of future revenue. Build from the ARR waterfall and work with your sales leader on pipeline conversion assumptions.
How do you forecast ARR?
Forecast ARR with an MRR waterfall. Start with beginning MRR, add new MRR and expansion MRR, then subtract contraction MRR and churned MRR separately. The result is ending MRR. Separating contraction from churn helps you understand whether existing-customer revenue loss is coming from downgrades, seat reductions, pricing changes, or full customer cancellations.
How do you forecast SaaS revenue?
Forecast SaaS revenue by stream. Subscription revenue should be forecast from ARR, bookings, churn, expansion, contract dates, and revenue recognition. Usage-based revenue should be forecast from customer usage patterns. Professional services revenue should be forecast from signed SOWs, backlog, and services pipeline.
What is the difference between ARR forecasting and revenue forecasting?
ARR forecasting projects the recurring revenue run-rate of the business. Revenue forecasting projects the amount of revenue recognized in the P&L during each accounting period. ARR and revenue are related, but they are not the same. Billing timing, contract dates, implementation timing, and revenue recognition rules can create differences between ARR, billings, and recognized revenue.
What is the right gross margin target for a SaaS company?
For pure subscription SaaS companies, many mature businesses target gross margin in the 70–80% range. If you are below 65%, dig into hosting costs, customer support burden, implementation costs, and services mix. The right benchmark depends on your stage, product complexity, hosting model, services mix, and customer segment. AI companies may run from 50% to 80% gross profit.
How detailed does the headcount plan need to be?
Every role should be mapped by department, start month, compensation, and fully loaded cost. You do not need to name every future hire, but you do need to know the role, timing, cost, and department. For example: “Add two AEs in Q2 at $110K OTE each, plus a 20% fringe benefit load.” That level of detail lets you see the actual cash impact month by month.
What is the difference between a budget and a forecast?
A budget is your annual operating plan. It is usually set once at the beginning of the year and used as the baseline for performance targets. A forecast is your current best estimate of where the year will end. It is updated regularly as actuals, sales pipeline, hiring, churn, and cash change. You need both. The budget sets accountability. The forecast drives decisions.
What should be included in a SaaS financial model?
A SaaS financial model should usually include revenue by stream, ARR waterfall, bookings, expansion, contraction, churn, headcount plan, wage expense, non-wage department expenses, Support and Services costs, COGS, gross margin, P&L, cash forecast, balance sheet assumptions if needed, and a SaaS metrics dashboard.
What is the best SaaS forecast template?
The best SaaS forecast template is one that is driver-based and built around how SaaS companies actually operate. It should include ARR, bookings, churn, expansion, revenue recognition, headcount, department expenses, cash, and SaaS metrics. A generic small business forecast template usually will not be detailed enough for a SaaS company.
How often should SaaS companies update their forecast?
Most SaaS companies should update their forecast monthly after the accounting close. At minimum, update it quarterly. High-growth or cash-constrained companies may need to update key parts of the forecast more frequently, especially bookings, cash, hiring, and runway.
What Excel skills do I need to build a SaaS forecast model?
You need solid formula skills, including SUMIF/SUMIFS, lookup formulas, date functions, scenario logic, and clean model structure. Dynamic arrays can help but are not required. The harder part usually is not Excel. The harder part is knowing the right SaaS forecast model structure.
Ben Murray is a SaaS CFO with 20+ years of experience in software finance and 1,000+ forecasts built for SaaS companies ranging from pre-revenue to $100M+ ARR. He teaches SaaS finance frameworks at TheSaaSAcademy.com.
