SaaS Metrics for Beginners: 10 KPIs Every Founder Should Track
If you’re new to SaaS metrics, it can feel like drinking from a fire hose.
ARR. MRR. NRR. CAC. LTV. Rule of 40.
Every investor, advisor, and operator seems to have a different opinion on what you should track. But here’s the truth: early-stage SaaS founders don’t need 50 metrics. They need the right 10. And depending on our stage, this could be just 3 SaaS metrics to begin with.
The goal is not to build the most complicated dashboard. The goal is to understand whether your SaaS or AI business is growing, retaining customers, generating healthy margins, and acquiring customers efficiently.
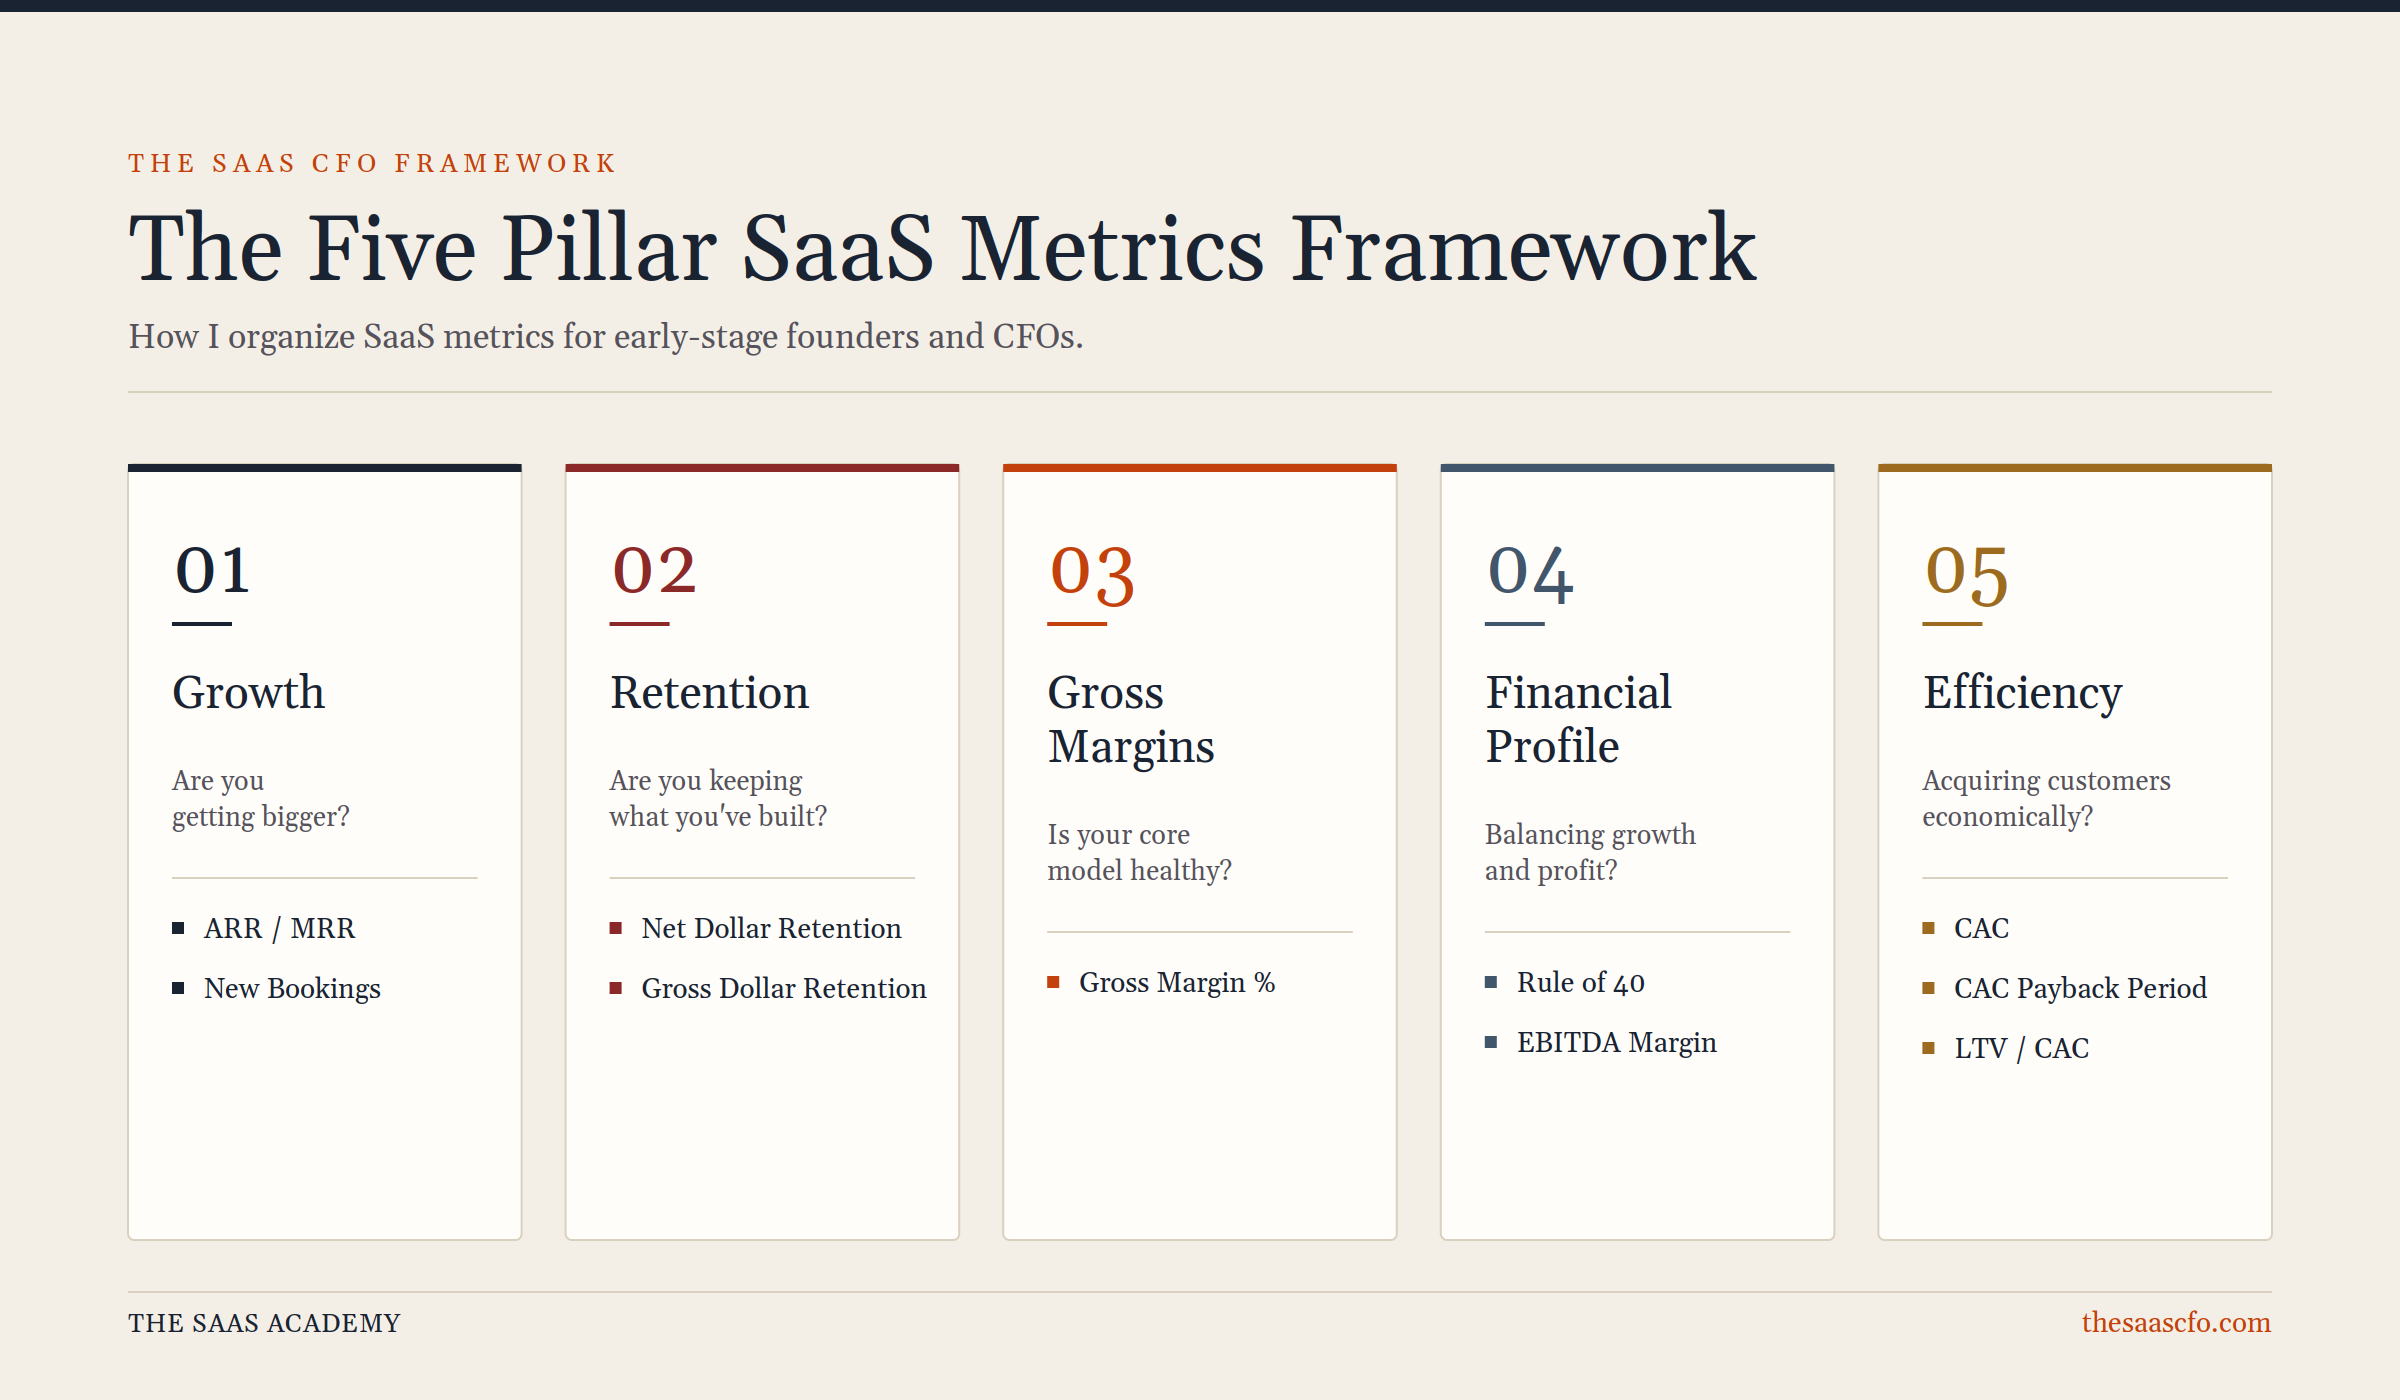
That’s why I organize SaaS metrics around my Five Pillar Framework:
- Growth — Are you getting bigger?
- Retention — Are you keeping what you’ve built?
- Gross Margins — Is your core business model healthy?
- Financial Profile — Are you balancing growth and profitability?
- Efficiency — Are you acquiring customers economically?
In this guide, I’ll walk through the 10 SaaS metrics every beginning software operator should understand, including formulas, examples, benchmarks, and how to use them in a simple SaaS metrics dashboard.
The 10 SaaS Metrics Every Beginner Should Track
Pillar 1: Growth
1) ARR / MRR
What it is:
MRR, or Monthly Recurring Revenue, is the recurring subscription revenue you generate each month. ARR, or Annual Recurring Revenue, is the annualized version.
Formula:
MRR = Sum of active monthly subscription revenue
ARR = MRR × 12
Example:
If you have 50 customers paying $200 per month, your MRR is $10,000 and your ARR is $120,000.
Benchmark:
ARR growth expectations vary by stage. As a general guide, companies under $1M ARR may target very high annual growth, while companies above $20M ARR typically grow at lower but more predictable rates. It really varies. Growth targets are very subjective depending you audience.
Why it matters:
ARR and MRR are the scoreboards of your SaaS business. Almost every other metric depends on having a clean recurring revenue number. Investors, acquirers, and board members all think in ARR-first terms.
2) New Bookings
What it is:
New Bookings measures new ARR added from new customers during a specific period. It excludes expansion revenue from existing customers. That would be expansion ARR bookings.
Formula:
New Bookings = ARR added from new customers in the period
Example:
You close five new customers in Q1 at $24,000 ARR each. New Bookings equals $120,000. This is tracked via your CRM software, or at a minimum, in spreadsheets.
Benchmark:
There is no universal target. What matters is consistency, trend, and performance versus your growth plan.
Why it matters:
New Bookings tells you whether your sales and marketing motion is working. If ARR is the scoreboard, New Bookings is the velocity meter.
A founder who does not separate new bookings from expansion revenue cannot tell whether growth is coming from new customers or existing customers. Those are very different business dynamics.
Pillar 2: Retention
3) Net Revenue Retention
What it is:
Net Revenue Retention, or NRR, measures how much ARR you retain from an existing customer cohort after expansion, contraction, and churn.
A number above 100% means existing customers are expanding faster than they are shrinking or churning.
Formula:
NDR = (Beginning ARR + Expansion ARR − Contraction ARR − Churned ARR) ÷ Beginning ARR × 100
Example:
You start the year with $1M ARR from existing customers. They expand by $150K, contract by $30K, and churn by $50K.
NDR = ($1,000,000 + $150,000 − $30,000 − $50,000) ÷ $1,000,000 = 107%
Benchmark:
You want above 100% NRR. Strong SaaS companies often target 110-120%+. Enterprise SaaS companies can be higher, while SMB SaaS companies may be lower. Retention targets vary based on your ACV profile.
Why it matters:
NRR may be the most important retention metric in SaaS and AI. High NRR means you can grow even before adding new customers because your existing customer base is expanding.
Gross Revenue Retention
What it is:
Gross Revenue Retention, or GRR, measures how much ARR you keep before expansion. It only accounts for contraction and churn.
Formula:
GDR = (Beginning ARR − Contraction ARR − Churned ARR) ÷ Beginning ARR × 100
Example:
Using the same numbers above:
GDR = ($1,000,000 − $30,000 − $50,000) ÷ $1,000,000 = 92%
Benchmark:
A GRR above 90% is generally healthy. Top-performing SaaS companies often reach 95% or better. By definition, GRR cannot exceed 100%. If you target B2C or offer a lower price point product, reaching 80% may be considered great. Again, it depends on your ACV and product type.
Why it matters:
GRR tells you how leaky your bucket is. A company can have strong RDR because expansion is covering up churn, but weak GRR still signals retention risk.
You want both: strong NRR and strong GRR. This will help your valuation discussions.
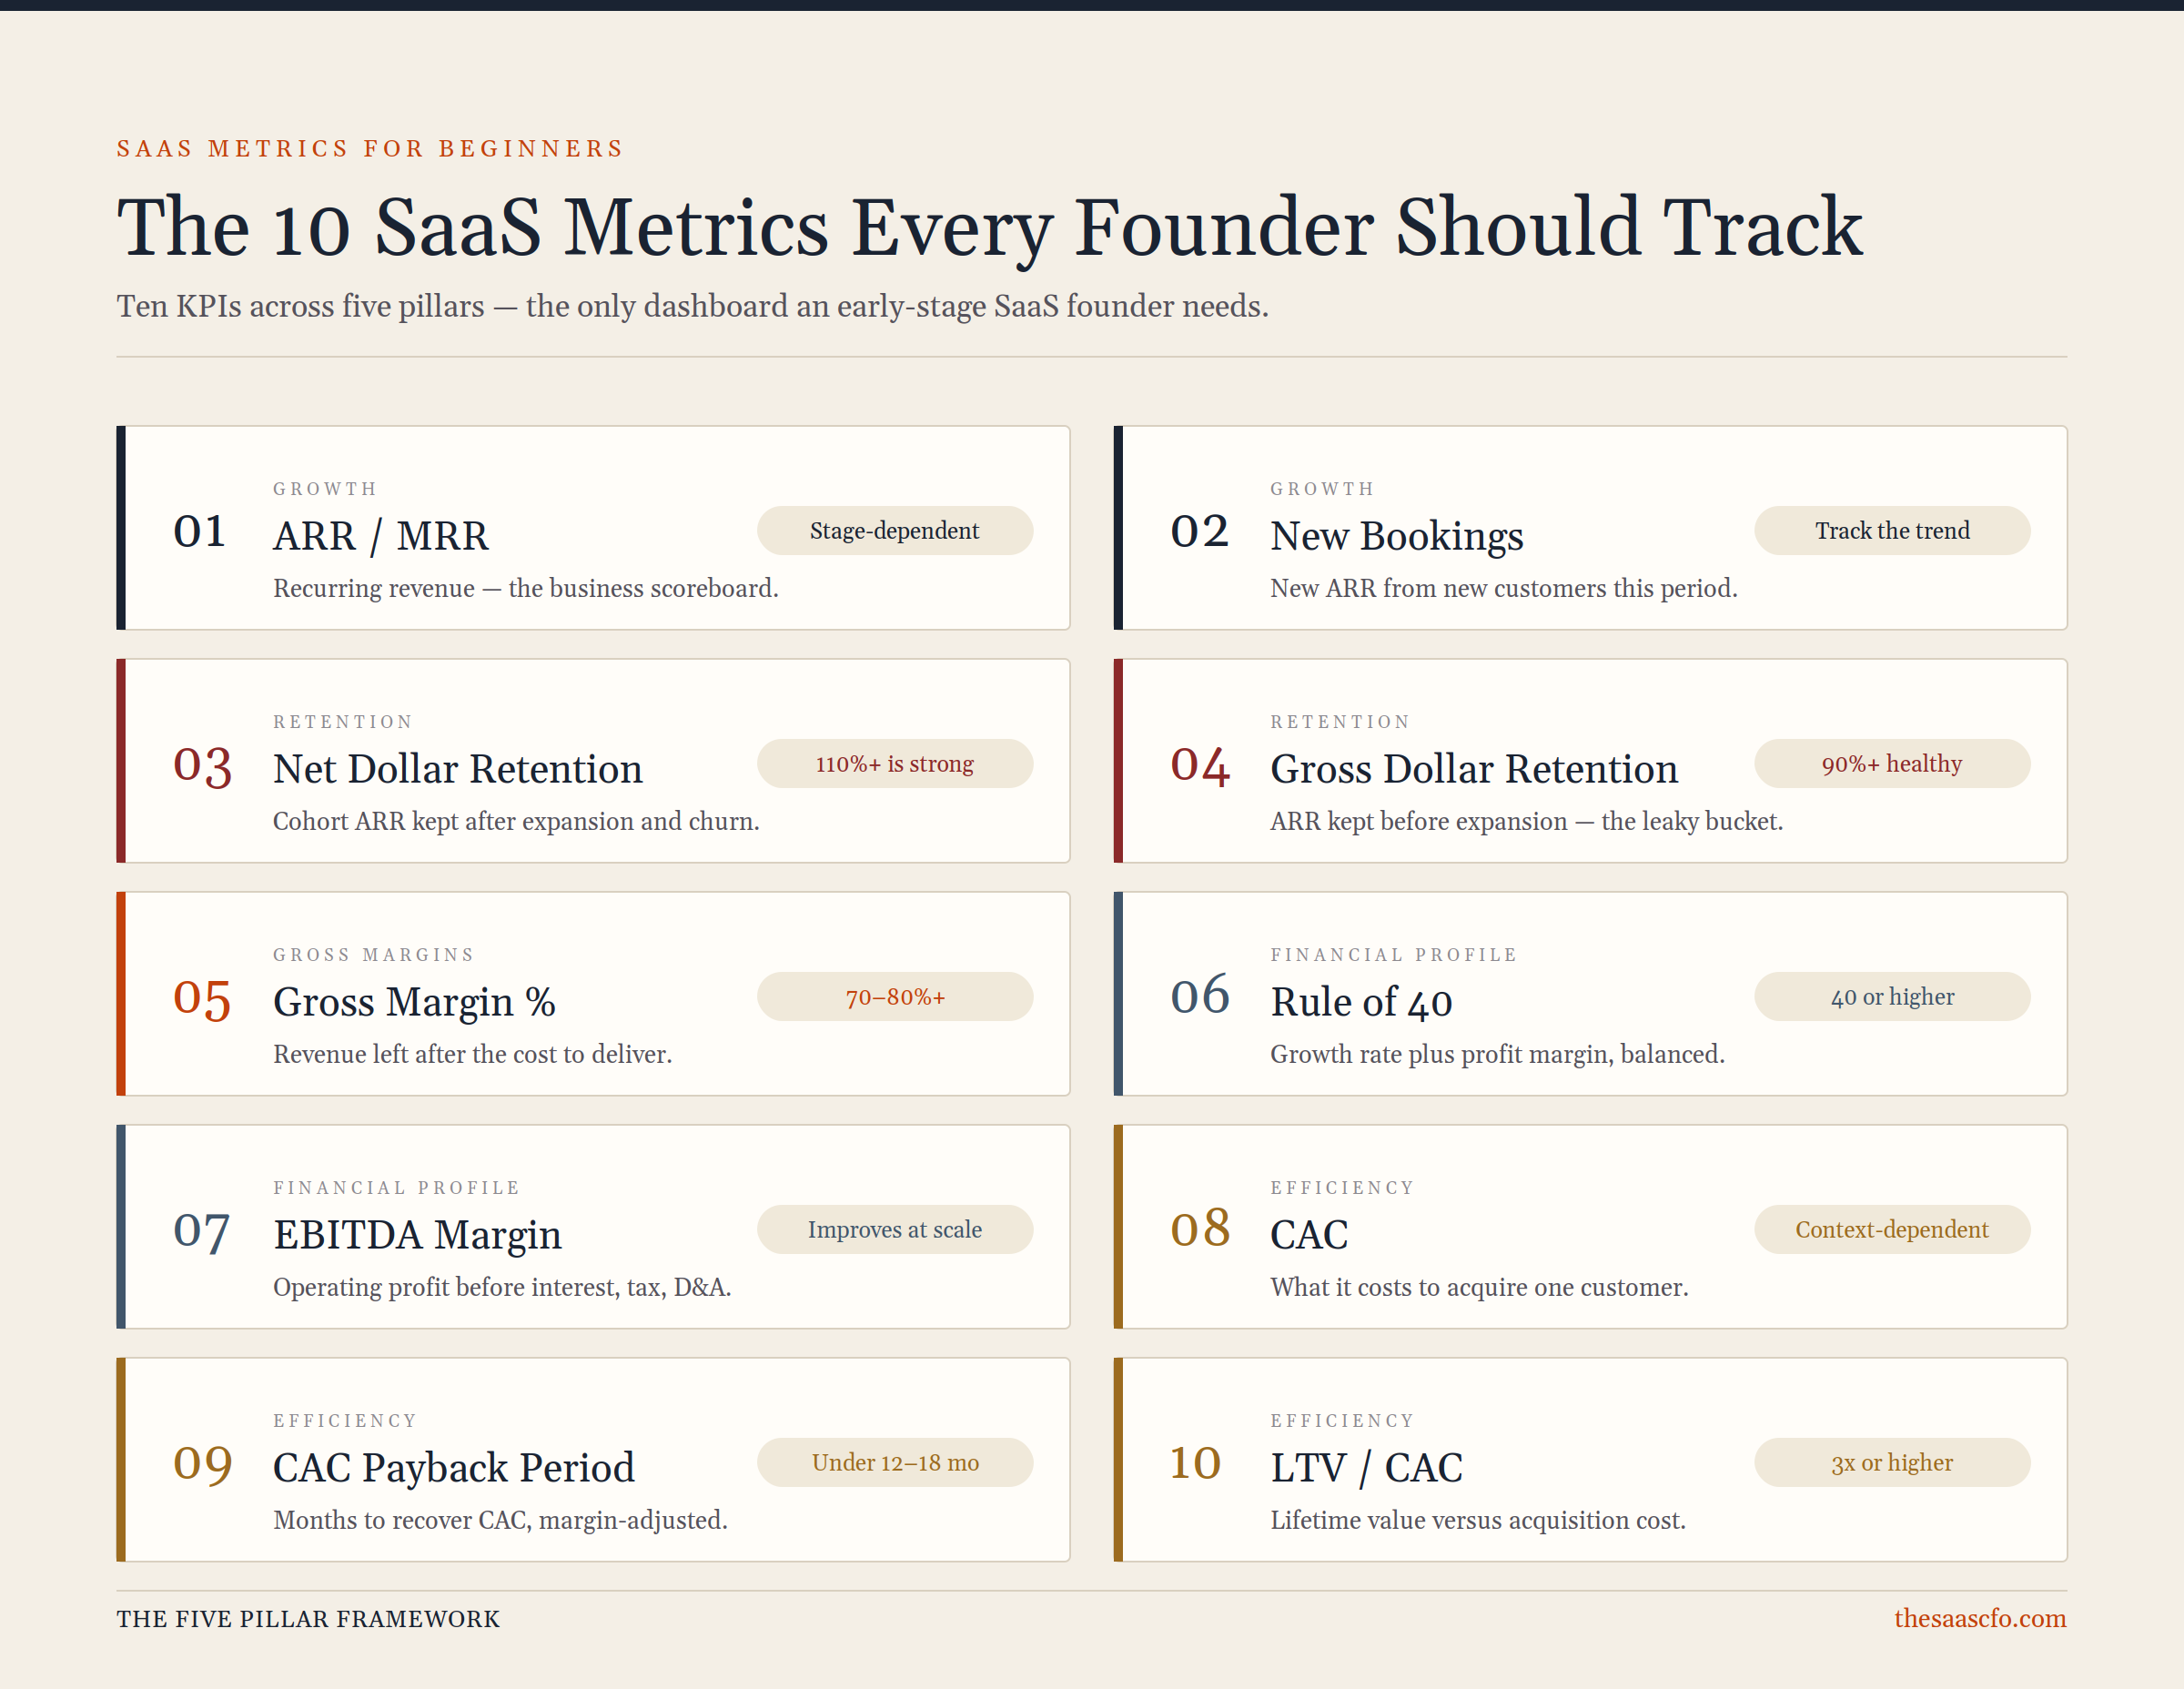
Pillar 3: Gross Margins
Gross Margin %
What it is:
Gross Margin is the percentage of revenue left after subtracting Cost of Goods Sold, or COGS. For SaaS, COGS often includes hosting, support, implementation costs, customer success if they don’t sell, and third-party software used to deliver the product.
Formula:
Gross Margin % = (Revenue − COGS) ÷ Revenue × 100
Example:
You generate $500,000 in revenue and have $100,000 in COGS.
Gross Margin = ($500,000 − $100,000) ÷ $500,000 = 80%
Benchmark:
Many SaaS companies target gross margins of 70% to 80%+. Pure software businesses often run higher, while companies with services, implementation, or heavy support needs may run lower. Margin is the great debate if you are running an AI company.
Why it matters:
Gross margin is the foundation of your financial model. If your gross margin is weak, you have less money available for sales, marketing, product, and G&A.
A SaaS company below 60% gross margin likely has a structural issue to investigate before scaling aggressively. However, if you are product is LLM-based, 50-60% gross margins may be good.
Pillar 4: Financial Profile
Rule of 40
What it is:
The Rule of 40 measures the balance between growth and profitability.
Formula:
Rule of 40 = ARR Growth Rate % + Profit Margin %
You can use EBITDA margin or free cash flow margin as the profit margin input.
Example:
You are growing ARR by 35% and have an 8% free cash flow margin.
Rule of 40 = 35% + 8% = 43%
Benchmark:
A score of 40 or higher is considered strong. Early-stage companies may hit this easily with high growth. It’s less meaningful in early-stage businesses but becomes more important as you scale.
Why it matters:
The Rule of 40 keeps founders from optimizing for only one thing.
Fast growth can justify negative margins. Strong profitability can justify slower growth. But slow growth plus heavy losses is a dangerous combination.
EBITDA Margin
What it is:
EBITDA Margin measures earnings before interest, taxes, depreciation, and amortization.
Formula:
EBITDA Margin = EBITDA ÷ Revenue × 100
Example:
You generate $2M in revenue and have negative EBITDA of $200K.
EBITDA Margin = -$200,000 ÷ $2,000,000 = -10%
Benchmark:
Negative EBITDA is common for early-stage SaaS companies, especially when they are investing in growth. But as companies scale, investors expect margins to improve.
Why it matters:
EBITDA Margin shows how much of each dollar of revenue is flowing through the operating model. It’s a long-term proxy for cash flow generation ability. Private equity loves EBITDA.
At $1M ARR, negative margins may be fine. At $20M ARR, burning heavily with modest growth becomes much harder to defend.
Pillar 5: Efficiency
Customer Acquisition Cost
What it is:
Customer Acquisition Cost, or CAC, measures how much it costs to acquire one new customer.
Formula:
CAC = Sales & Marketing Spend (NEW) ÷ Number of New Customers Acquired
Example:
You spend $300,000 on sales and marketing in Q2 and acquire 30 new customers.
CAC = $300,000 ÷ 30 = $10,000 per customer
Benchmark:
CAC varies widely based on ACV, market, and go-to-market motion. The number matters most when viewed against the payback period and customer lifetime value.
Why it matters:
CAC is the price you pay to grow.
If you do not know your CAC, you do not know whether your growth is economically rational. Many founders are surprised to learn they are spending more to acquire a customer than that customer is worth. Don’t forget to allocated S&M between new and existing acquisition.
CAC Payback Period
What it is:
CAC Payback Period measures how many months it takes to recover your customer acquisition cost on a gross-margin-adjusted basis.
Formula:
CAC Payback = CAC ÷ (Cohort MRR × Gross Margin %)
Example:
CAC is $10,000. Newly acquired MRR per customer is $500. Gross margin is 75%.
CAC Payback = $10,000 ÷ ($500 × 75%) = 26.7 months
Benchmark:
Benchmarks depend on your product ACV. Don’t fall for the posts that say you are doing well at X months of CAC Payback Period. It depends. My SaaS Metrics Foundation includes the latest SaaS metrics benchmarks.
Why it matters:
CAC Payback tells you how long your cash is tied up before a new customer becomes profitable.
The shorter the payback period, the more efficiently you can reinvest in growth.
LTV/CAC Ratio
What it is:
LTV/CAC compares customer lifetime value to customer acquisition cost.
Formula:
LTV = (Newly Acquired MRR per Customer × Subscription Gross Margin %) ÷ Monthly Churn Rate
LTV/CAC = LTV ÷ CAC
Example:
New MRR per customer is $500. Gross margin is 75%. Monthly churn is 2%.
LTV = ($500 × 75%) ÷ 2% = $18,750
If CAC is $10,000:
LTV/CAC = 1.9x
That needs work.
Benchmark:
A common target is 3x or higher. Strong SaaS companies may reach 5x or better. Below 3x usually means you need to reduce CAC, increase pricing, improve retention, or some combination of all three.
Why it matters:
LTV/CAC is one of the clearest indicators of whether your SaaS business model works. I really like LTV to CAC for B2C or low price point B2B businesses. It becomes less reliable in enterprise motions.
If you spend $1 to acquire a customer and generate $3 or more in LTV, you may have a scalable acquisition model.
Beginner SaaS Metrics Dashboard
If you are building your first SaaS metrics dashboard, do not overcomplicate it.
Start with these 10 KPIs:
|
Pillar |
Metric |
|
Growth |
ARR / MRR |
|
Growth |
New Bookings |
|
Retention |
Net Dollar Retention |
|
Retention |
Gross Dollar Retention |
|
Gross Margins |
Gross Margin % |
|
Financial Profile |
Rule of 40 |
|
Financial Profile |
EBITDA Margin |
|
Efficiency |
CAC |
|
Efficiency |
CAC Payback Period |
|
Efficiency |
LTV/CAC |
At a minimum, your dashboard should show current value, prior period, trend, and benchmark for each metric.
Benchmarks are helpful, but they are not universal. SaaS metrics vary by company stage, ACV, customer segment, pricing model, and go-to-market motion. Use benchmarks as directional ranges, not absolute rules.
Summary: The 10 Most Important SaaS KPIs
|
Metric |
Formula |
Good Target |
|
ARR / MRR |
MRR × 12 = ARR |
Stage-dependent |
|
New Bookings |
ARR from new customers |
Consistent growth |
|
NDR |
Beginning ARR + Expansion − Contraction − Churn |
100%+ |
|
GDR |
Beginning ARR − Contraction − Churn |
90%+ |
|
Gross Margin |
Revenue − COGS ÷ Revenue |
70–80%+ |
|
Rule of 40 |
Growth % + Profit Margin % |
40+ |
|
EBITDA Margin |
EBITDA ÷ Revenue |
Improves with scale |
|
CAC |
S&M Spend ÷ New Customers |
Context-dependent |
|
CAC Payback |
CAC ÷ Gross Margin Adjusted MRR |
<12–18 months |
|
LTV/CAC |
LTV ÷ CAC |
3x+ |
Where Do You Go From Here?
These 10 SaaS metrics give you a clear view of your business across growth, retention, margins, financial profile, and efficiency.
But knowing the metrics is only the first step. The next step is turning them into a working SaaS metrics dashboard with clean definitions, accurate formulas, and benchmarks you can actually use.
That is exactly what I teach inside The SaaS Academy:
SaaS Metrics Crash Course
A free, CPE-eligible course that helps you understand the fundamentals quickly. Learn more here.
SaaS Metrics Foundation
My full course which goes deeper into every metric, shows you how to build a SaaS metrics dashboard, and gives you the frameworks I use with SaaS companies from $1 to $100M+ ARR. Learn more here.
CTA: Start the SaaS Metrics Crash Course or explore SaaS Metrics Foundation.
FAQ: SaaS Metrics for Beginners
What are SaaS metrics?
SaaS metrics are the key performance indicators used to measure the health of a subscription software business. They help founders understand growth, retention, profitability, and customer acquisition efficiency.
What is the most important SaaS metric for beginners?
Start with MRR, ARR, and Gross Revenue Retention. MRR and ARR tell you whether you are growing. GRR tells you whether you are keeping the revenue you already earned.
What should be included in a SaaS metrics dashboard?
A beginner SaaS metrics dashboard should include ARR, MRR, New Bookings, NRR, GRR, Gross Margin, Rule of 40, EBITDA Margin, CAC, CAC Payback, and LTV/CAC.
What is the difference between NRR and GRR?
GRR measures how much revenue you keep before expansion. NRR includes expansion revenue. GRR shows how much revenue you retain. NRR shows whether existing customers are growing over time.
When should a SaaS founder start tracking metrics?
You should start tracking basic metrics as soon as you have your first paying customer. Begin with MRR and ARR, then add retention, margin, and efficiency metrics as you collect more data.
Is negative EBITDA bad for a SaaS company?
Not always. Negative EBITDA can be acceptable for an early-stage SaaS company investing in growth. But as the company scales, margins should improve, especially if growth slows.
Ben Murray is The SaaS CFO. He has spent 25+ years in finance and accounting, worked with 100+ SaaS companies, and created the Five Pillar Framework for SaaS metrics.
